TLDR, show me code ![]() kafka-prometheus-monitoring
kafka-prometheus-monitoring
Apache Kafka is publish-subscribe messaging rethought as a distributed commit log. It is scaleable, durable and distributed by design which is why it is currently one of the most popular choices when choosing a messaging broker for high throughput architectures.
One of the major differences with Kafka is the way it manages state of the consumers, this itself is distributed with the client responsible for keeping track of the messages they have consumed (this is abstracted by the high level consumer in later versions of Kafka with offsets stored in Zookeeper). In contrast to more traditional MQ messaging technologies, this inversion of control takes considerable load off the server.
The scalability, speed and resiliency properties of Kafka is why it was chosen for a project I worked on for my most recent client Sky. Our use case was for processing realtime user actions in order to provide personalised Recommendations for the NowTV end users, a popular web streaming service available on multiple platforms. We needed a reliable way to monitor our Kafka cluster to help inform key performance indictors during NFT testing.
Prometheus JMX Collector
Prometheus is our monitoring tool of choice and Apache Kafka metrics are exposed by each broker in the cluster via JMX, therefore we need a way to extract these metrics and expose them in a format suitable for Prometheus. Fortunately prometheus.io provides a custom exporter for this. The Prometheus JMX Exporter is a lightweight web service which exposes Prometheus metrics via a HTTP GET endpoint. On each request it scrapes the configured JMX server and transforms JMX mBean query results into Prometheus compatible time series data, which are then returned to the caller via HTTP.
The mBeans to scrape are controlled by a yaml configuration where you can provide a white/blacklist of metrics to extract and how to represent these in Prometheus, for example GAUGE or COUNTER. The configuration can be tuned for your specific requirements, a list of all metrics can be found in the Kafka Operations documentation. Here is what our configuration looked like:
lowercaseOutputName: true
jmxUrl: service:jmx:rmi:///jndi/rmi://{{ getv "/jmx/host" }}:{{ getv "/jmx/port" }}/jmxrmi
rules:
- pattern : kafka.network<type=Processor, name=IdlePercent, networkProcessor=(.+)><>Value
- pattern : kafka.network<type=RequestMetrics, name=RequestsPerSec, request=(.+)><>OneMinuteRate
- pattern : kafka.network<type=SocketServer, name=NetworkProcessorAvgIdlePercent><>Value
- pattern : kafka.server<type=ReplicaFetcherManager, name=MaxLag, clientId=(.+)><>Value
- pattern : kafka.server<type=BrokerTopicMetrics, name=(.+), topic=(.+)><>OneMinuteRate
- pattern : kafka.server<type=KafkaRequestHandlerPool, name=RequestHandlerAvgIdlePercent><>OneMinuteRate
- pattern : kafka.server<type=Produce><>queue-size
- pattern : kafka.server<type=ReplicaManager, name=(.+)><>(Value|OneMinuteRate)
- pattern : kafka.server<type=controller-channel-metrics, broker-id=(.+)><>(.*)
- pattern : kafka.server<type=socket-server-metrics, networkProcessor=(.+)><>(.*)
- pattern : kafka.server<type=Fetch><>queue-size
- pattern : kafka.server<type=SessionExpireListener, name=(.+)><>OneMinuteRate
- pattern : kafka.controller<type=KafkaController, name=(.+)><>Value
- pattern : kafka.controller<type=ControllerStats, name=(.+)><>OneMinuteRate
- pattern : kafka.cluster<type=Partition, name=UnderReplicated, topic=(.+), partition=(.+)><>Value
- pattern : kafka.utils<type=Throttler, name=cleaner-io><>OneMinuteRate
- pattern : kafka.log<type=Log, name=LogEndOffset, topic=(.+), partition=(.+)><>Value
- pattern : java.lang<type=(.*)>
In summary:
- Prometheus JMX Exporter – scrapes the configured JMX server and transforms JMX mBean query results into Prometheus compatible time series data, exposes result via HTTP
- JMX Exporter Configuration – a configuration file that filters the JMX properties to be transformed – example Kafka configuration
- Prometheus – prometheus itself is configured to poll the JMX Exporter /metrics endpoint
- Grafana – allows us to build rich dashboards from collected metrics
Viewing Kafka Metrics
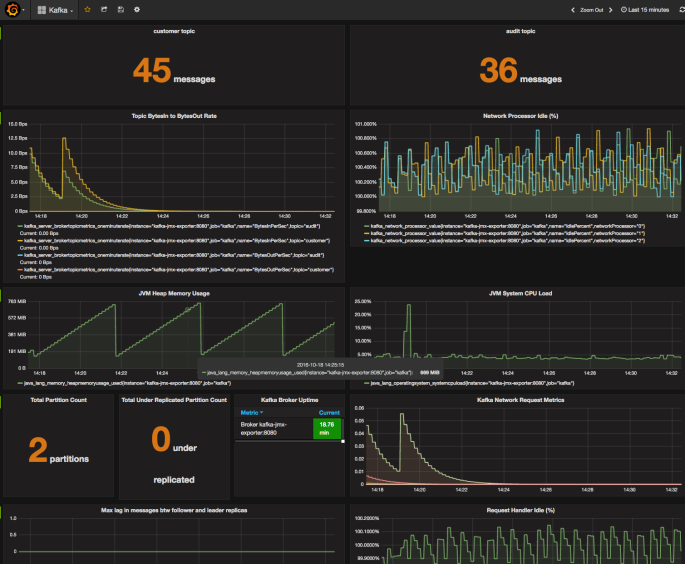
Once metrics have been scraped into Prometheus they can be browsed in the Prometheus UI, alternatively richer dashboards can be built using Grafana.


In order to try this out locally, a fully dockerised example which has been provided on GitHub – kafka-prometheus-monitoring. This project is for demonstration purposes only and is not intended to be run in a production environment. This is only scratching the surface of monitoring and fine-tuning the Kafka brokers but it is a good place to start in order to enable performance analysis of the cluster.
A note on monitoring a cluster of brokers: Prometheus metrics will include a label which denotes the Brokers IP address, this allows you to distinguish metrics per broker. Therefore a JMX exporter will need to be run for each broker and Prometheus should be configured to poll each deployed JMX exporter.


Hi. Thank you for the article. Are there any already prepared Docker images to use? I need to install this tool for mine Kubernetes cluster.
Thanks again.
LikeLike
Not currently, the docker containers provided here are for demonstration purposes and may need some further work before being production ready. Feel free to extend/upload to DockerHub if required.
LikeLike
Hi,
I’m trying to set the described configurations.
Can you please detail how to start the JMX exporter.
Looking at here : github.com/prometheus/jmx_exporter seems it should be started as javaagent
“java -javaagent:target/jmx_prometheus_javaagent-0.8-SNAPSHOT-jar-with-dependencies.jar=1234:config.yaml -jar yourJar.jar” but what I miss is what’s the yourJar.jar.
Did you set in the same way or in some other way?
Thanks
Maurizio
LikeLike
The example here starts it as a standalone http server (this is run in a docker container for demonstration purposes):
https://github.com/rama-nallamilli/kafka-prometheus-monitoring/blob/master/prometheus-jmx-exporter/confd/templates/start-jmx-scraper.sh.tmpl
The method you described is when you want to run the jmx exporter in the same JVM that your target process is running in.
The github page https://github.com/prometheus/jmx_exporter describes both methods, as I did not want to modify the kafka distribution to include the agent I opted to have them decoupled and went for the approach of running it as a separate http service (see https://github.com/prometheus/jmx_exporter/blob/master/run_sample_httpserver.sh).
Hope this helps.
LikeLike
Hi,
Can I change the config to include more metrics as this is a cut-down version of the available Kafka metrics?
LikeLike
Hi David,
PRs are accepted and greatly appreciated, if you still want to make the changes you can fork the repository and raise a PR. I can then approve/merge.
Thanks Rama
LikeLike